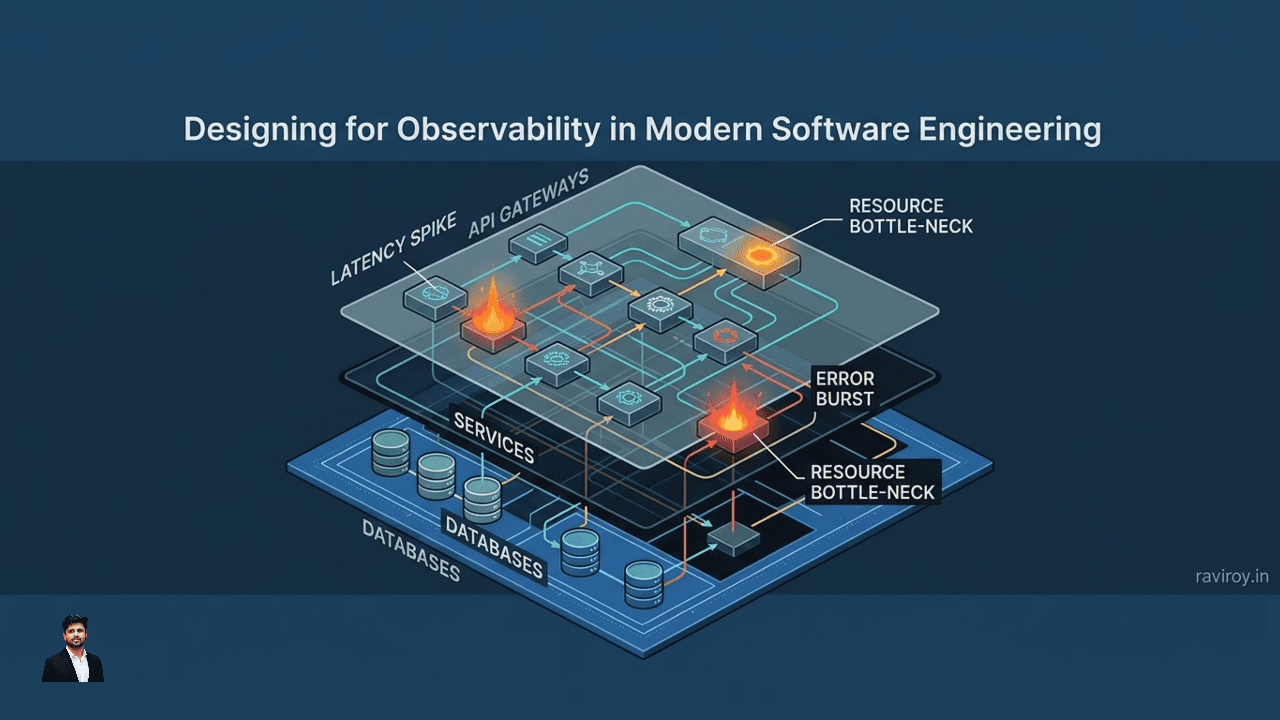
Imagine navigating a complex city without a map, street signs, or even a working compass. That's often what debugging modern, distributed software systems feels like without robust observability. For any organization building sophisticated applications, designing for observability in modern software engineering is no longer a luxury—it's a foundational necessity for understanding system behavior and ensuring operational excellence.
What is Observability in Software Engineering?
At its core, observability in software engineering is the ability to infer the internal state of a system by examining the data it outputs. Unlike traditional monitoring, which often focuses on known-unknowns (e.g., "Is CPU utilization above 80%?"), observability empowers engineers to answer novel questions about system behavior and debug unknown-unknowns. It's about having enough rich data to ask "why" something is happening, not just "what" is happening.
Consider a microservices architecture with dozens or hundreds of independent services communicating asynchronously. When a customer reports a slow transaction, simply seeing that a database server's CPU is high doesn't tell the whole story. Observability provides the contextual data—logs, metrics, and traces—that allows you to pinpoint which specific service initiated the problematic request, how it traversed the system, and where it bottlenecked. This deep insight is critical for diagnosing performance issues, debugging failures, and understanding the complex interactions within today's highly distributed systems. It's the difference between seeing a red light on a dashboard and understanding the precise failing component, its history, and its impact.
The Three Pillars: Logs, Metrics, and Traces
Observability is built upon three fundamental data types, often referred to as "the three pillars." Each provides a unique lens into the system, and together, they offer a holistic view.
Structured Logging for Context
Logs are immutable, timestamped records of discrete events that occur within an application or system. While traditional, unstructured logs (e.g., plain text output) can be useful, structured logging elevates their utility significantly. Structured logs format data, typically as JSON, making them easily parseable, queryable, and analyzable by machines.
Benefits of Structured Logs:
Machine Readability: Automated tools can easily parse specific fields.
Queryability: You can filter and search logs efficiently based on any field (e.g., all errors from
service-paymentforuser_id: 123).Contextual Richness: Embed detailed information beyond a simple message.
Correlation: Easily link related log entries using common identifiers.
Examples of Essential Fields in Structured Logs:
timestamp: When the event occurred (ISO 8601 format is best).service_name: The name of the service generating the log.level: Severity of the event (e.g., DEBUG, INFO, WARN, ERROR, CRITICAL).message: A human-readable description of the event.correlation_id(ortrace_id): A unique identifier linking events across a request's lifecycle.user_id: Identifier for the end-user, if applicable.resource_id: Identifier for the specific resource being acted upon.environment: (e.g.,production,staging,development).
Here’s a simple example of a structured log entry:
{
  "timestamp": "2023-10-27T10:30:00.123Z",
  "service_name": "order-processor",
  "level": "ERROR",
  "message": "Failed to process order due to payment gateway timeout",
  "correlation_id": "abc-123-xyz",
  "order_id": "ORD-45678",
  "customer_id": "CUST-998",
  "exception_type": "PaymentGatewayTimeoutException"
}
Comprehensive Metrics for Insight
Metrics are numerical measurements collected over time, representing a specific aspect of a system at a particular moment. They are aggregate, lightweight, and perfect for real-time monitoring, alerting, and trend analysis.
Types of Metrics and Their Use Cases:
Counters: Monotonically increasing values that represent a cumulative total.
Use Case: Total number of HTTP requests, errors encountered, bytes transferred.
Gauges: A single numerical value that can go up or down.
Use Case: Current CPU utilization, memory usage, number of active users, queue size.
Histograms/Summaries: Track the distribution of values, such as response times or request durations, over a given time period. They allow for calculating percentiles (e.g., p99 latency) to understand performance variability.
Use Case: HTTP request durations, database query latencies.
Collection and Aggregation: Metrics are typically collected by agents or SDKs embedded in applications and then sent to a time-series database. Tools like Prometheus excel at this, scraping metrics endpoints and storing them efficiently. Aggregation involves summarizing raw metrics (e.g., calculating the average response time over a minute) to reduce data volume and highlight trends. Dashboards then visualize these aggregated metrics to show system health and performance at a glance.
Distributed Tracing for Understanding Flow
Distributed tracing is the process of tracking a single request or transaction as it propagates through multiple services in a distributed system. It reconstructs the end-to-end flow, providing a visual map of how different components interact and where latency or errors might be introduced.
How it Works:
Each request is assigned a unique trace_id when it enters the system. As the request travels from service to service, each operation within a service (e.g., a database query, an API call to another service) becomes a "span." Each span has a span_id and references its parent span_id, forming a hierarchy within the trace. This allows you to see the exact sequence and duration of operations.
Illustrative Example: A user clicks "Buy Now."
Service A (Frontend): Receives request, generates
trace_idandspan_id_A. Calls Service B.Service B (Order Processing): Receives request with
trace_id, generatesspan_id_B(parentspan_id_A). Calls Service C.Service C (Payment Gateway): Receives request with
trace_id, generatesspan_id_C(parentspan_id_B). Processes payment. Returns to B.Service B processes order, returns to A.
Service A responds to user.
A tracing tool would visualize this as a waterfall diagram, showing the duration of each span and revealing if Service C, for instance, took an unusually long time, impacting the overall transaction latency.
Together, logs provide granular event details, metrics offer aggregated system health, and traces reveal the journey of individual requests, collectively providing a powerful, holistic view of your system's behavior.
Essential Design Patterns for Observability
Implementing observability effectively requires more than just collecting data; it demands thoughtful design patterns integrated throughout the development lifecycle.
Instrumentation at the Source
Instrumentation is the process of adding code to your applications or configuration to your infrastructure to emit observability data. The most effective observability begins at the source, embedded directly within your services and infrastructure components from day one.
Importance:
Early Detection: Issues can be identified and addressed during development or testing, shifting observability "left."
Contextual Data: Engineers who write the code have the best understanding of what data is most valuable to emit.
Reduced Friction: Integrating instrumentation early prevents retrospective, often costly, efforts to add it later.
Open Standards like OpenTelemetry: OpenTelemetry (OTel) has emerged as a crucial open standard for instrumentation. It provides a vendor-neutral set of APIs, SDKs, and tools for generating and collecting telemetry data (logs, metrics, and traces). By using OpenTelemetry, you avoid vendor lock-in, enabling you to switch observability backends or integrate with various tools without rewriting your instrumentation code. This allows for consistent data collection across different languages and services.
Centralized Data Collection and Aggregation
Once data is emitted, it needs to be efficiently collected, processed, and stored in a central location for analysis. This is vital for correlating disparate data points and gaining a unified view.
Strategies for Data Collection:
Agents: Lightweight software installed on hosts or containers that collect logs, metrics, and sometimes traces (e.g., Prometheus Node Exporter, Logstash Agent, OpenTelemetry Collector).
Sidecars: A separate container deployed alongside your application container in a Kubernetes pod, specifically for collecting observability data, abstracting the collection logic from the application.
SDKs: Libraries integrated directly into your application code to emit data using standard protocols (e.g., OpenTelemetry SDKs).
APIs/Webhooks: For external services or serverless functions to push data to your observability platform.
Benefits of a Unified Observability Platform: A unified platform consolidates logs, metrics, and traces into a single pane of glass. This is crucial for:
Correlation: Easily jump from a metric spike to the relevant traces and logs that explain it.
Reduced Context Switching: Engineers don't need to juggle multiple tools.
Comprehensive Analysis: Tools can perform advanced analytics across all data types.
Contextual Dashboards and Alerting
Raw data is only useful if it can be presented in an actionable way. Dashboards and alerts are the user interfaces for your observability data, turning raw information into insights.
Effective Dashboard Design:
Contextual Linking: Dashboards should allow you to drill down from high-level summaries (e.g., "Service Health") to specific details (e.g., "Latency for
Auth Service") and then directly link to relevant traces or logs.Key Performance Indicators (KPIs): Focus on metrics that truly matter for business outcomes and user experience (e.g., latency, error rate, throughput, saturation).
Service-Oriented Views: Create dashboards tailored to specific services or teams, showing the most relevant metrics, logs, and traces for that component.
Visual Correlation: Display related metrics, traces, and logs side-by-side or layered to make correlations visually apparent.
Actionable Alerts: Alerts should notify the right people, at the right time, with sufficient context to act immediately.
Minimize Noise: Set alerts based on meaningful thresholds and error rates, not just every anomaly. Avoid "flapping" alerts.
Context-Rich Notifications: Alert messages should include direct links to relevant dashboards, logs, or traces to speed up incident response.
Playbooks: Associate alerts with pre-defined runbooks or playbooks to guide responders on initial troubleshooting steps.
AI-Powered Anomaly Detection: Leverage machine learning to automatically identify unusual patterns in metrics or logs that might indicate a problem before it escalates, reducing the need for manual threshold setting and proactive issue identification.
Key Benefits of Designing for Observability
Investing in robust observability practices yields significant returns across the entire software development and operations lifecycle.
Faster Mean Time to Resolution (MTTR): When an incident occurs, observability provides the comprehensive data needed to quickly pinpoint the root cause. Instead of spending hours sifting through fragmented logs or making educated guesses, engineers can swiftly navigate traces, correlate metrics, and examine structured logs to identify the problem area. This dramatically reduces the time it takes to detect, diagnose, and resolve issues, minimizing downtime and business impact.
Improved System Reliability and Performance: By continuously monitoring system health with comprehensive metrics and identifying bottlenecks through tracing, teams can proactively optimize performance. Observability data allows for the early detection of degrading service levels, potential resource contention, or inefficient code paths, enabling fixes before they impact users. This proactive approach directly contributes to a more stable and reliable system.
Enhanced User Experience: A reliable and performant system directly translates to a better user experience. Observability helps ensure that applications respond quickly, are always available, and function as expected. By understanding the performance characteristics from an end-user perspective (e.g., frontend latency metrics, synthetic transaction monitoring), teams can prioritize improvements that directly impact customer satisfaction.
Efficient Resource Utilization and Cost Optimization: Observability provides clear insights into how your resources (CPU, memory, network, disk) are being consumed by different services. This data is invaluable for identifying over-provisioned resources that can be scaled down, optimizing cloud spend. Conversely, it helps identify under-provisioned services that might be struggling, allowing for strategic scaling up to prevent performance degradation. By understanding usage patterns, organizations can make data-driven decisions on infrastructure investments and achieve significant cost savings.
Informed Development and Architectural Decisions: The wealth of data gathered through observability informs future development and architectural choices. Seeing which services are frequently called, which APIs are problematic, or which parts of the system are most latency-sensitive provides empirical evidence for refactoring efforts, redesigns, or capacity planning. It enables a data-driven approach to evolving the software, ensuring that changes are based on real-world operational insights rather than assumptions.
Observability in Modern Software Development Practices
The landscape of software development is constantly evolving, and observability practices must evolve with it to remain effective.
Shift-Left Observability and Developer Integration
"Shift-left" observability means integrating observability concerns and tools earlier in the software development lifecycle, empowering developers to build observable systems from the outset.
Advantages for Developers:
Faster Local Debugging: Developers can instrument and observe their code locally or in development environments, catching issues before deployment.
Contextual Understanding: They gain a deeper understanding of how their code behaves in various environments.
Ownership: Fosters a culture where developers are responsible for the operability of their code, not just its functionality.
Integration into CI/CD Pipelines and Local Development:
CI/CD: Automated tests can leverage observability data. For example, performance tests can check for latency regressions using metrics and traces. New services can be automatically scanned for proper OpenTelemetry instrumentation.
Local Development: Provide developers with local observability stacks (e.g., containerized Prometheus, Grafana, Jaeger) that they can run alongside their services to observe behavior in real-time during coding. Encourage standardized logging and metric emission through templates and code generators.
Cloud-Native and Serverless Observability
Cloud-native architectures, with their ephemeral containers, microservices, and serverless functions, present unique challenges for observability.
Unique Challenges:
Ephemerality: Instances come and go rapidly, making it hard to track state.
Distributed Nature: Many small, independent services communicating over networks.
Polyglot Environments: Services written in different languages with varying runtimes.
Managed Services: Reduced control over underlying infrastructure makes traditional host-based monitoring less relevant.
Strategies:
Standardized Instrumentation: Crucial for consistency across diverse services. OpenTelemetry becomes even more vital here.
Service Mesh: Technologies like Istio or Linkerd can automatically inject tracing and metrics collection without application code changes, particularly useful in Kubernetes environments.
Managed Observability Services: Cloud providers offer their own observability suites (e.g., AWS CloudWatch, Azure Monitor, Google Cloud Operations Suite) that integrate natively with their serverless and container services.
Event-Driven Monitoring: Focus on events emitted by serverless functions and managed services rather than traditional host-level metrics.
Cost Optimization Through Smart Data Management
The sheer volume and velocity of observability data generated by modern systems can lead to significant storage and processing costs. Smart data management is essential.
Techniques for Balancing Data Retention with Cost:
Sampling: For high-volume data like traces, instead of storing every single trace, sample a representative subset (e.g., 10% of all traces, or all traces that result in an error). This reduces volume while maintaining statistical significance.
Aggregation: Summarize detailed metrics into coarser-grained aggregates over longer time periods. For example, keep minute-by-minute averages for 30 days, hourly averages for 90 days, and daily averages for a year.
Intelligent Filtering: Filter out "noisy" or less critical log entries at the source or during collection. For instance,
DEBUGlevel logs might be dropped in production or only sent to low-cost storage, whileERRORlogs go to immediate analysis.Tiered Storage: Use cheaper, slower storage tiers for older or less frequently accessed data, while keeping recent, high-value data in faster, more expensive storage.
Data Lifecycle Management: Implement policies for automatic archival or deletion of data based on its age and business value.
By leveraging unified platforms that can manage and analyze this diverse data, organizations can gain comprehensive insights while keeping costs under control.
Practical Tools and Technologies for Your Observability Stack
Building an effective observability stack often involves combining various specialized tools. Here's a look at some popular options:
OpenTelemetry (Standardization): As discussed, OpenTelemetry is not a backend but a set of standards and SDKs for instrumenting your applications to emit logs, metrics, and traces. It's the vendor-neutral glue that connects your applications to your observability backend. It ensures consistency and portability of your telemetry data.
Prometheus (Metrics): An open-source monitoring system and time-series database. Prometheus is excellent for collecting and storing metrics, offering a powerful query language (PromQL) and flexible alerting capabilities. It works by "scraping" metrics endpoints exposed by applications and services.
Grafana (Dashboards): A popular open-source platform for data visualization and analytics. Grafana can connect to various data sources (including Prometheus, Elasticsearch, Loki, and many commercial platforms) to create dynamic, interactive dashboards for visualizing metrics, logs, and traces. It's highly customizable and widely used for operational intelligence.
ELK Stack (Elasticsearch, Logstash, Kibana) or Loki (Logging):
ELK Stack: A powerful suite for centralized logging. Elasticsearch provides scalable full-text search and analytics, Logstash ingests and transforms logs from various sources, and Kibana offers visualization and dashboarding. It's robust but can be resource-intensive.
Loki: Inspired by Prometheus, Loki is a log aggregation system specifically designed for storing and querying logs. It focuses on indexing metadata rather than full log content, making it very cost-effective and efficient for querying logs when combined with Grafana.
Jaeger or Tempo (Distributed Tracing Backends):
Jaeger: An open-source distributed tracing system inspired by Google's Dapper. It's used for monitoring and troubleshooting complex microservices-based architectures, allowing engineers to visualize the full request path and identify performance bottlenecks.
Tempo: Grafana's open-source distributed tracing backend. It is designed for high-scale trace storage with a focus on cost-effectiveness, using object storage as its primary backend. It integrates seamlessly with Grafana and Prometheus.
Commercial Unified Observability Platforms: Vendors like Datadog, New Relic, Dynatrace, Honeycomb, and Splunk offer comprehensive, all-in-one platforms that combine logs, metrics, and traces, often with advanced AI/ML capabilities, incident response, and user experience monitoring. Their advantages include ease of setup, integrated analytics, and often dedicated support, at a higher cost.
Choosing the Right Tools: The selection depends on your project's scale, architectural complexity, team expertise, and budget.
Small Projects: Open-source tools (Prometheus + Grafana + Loki/ELK) can be powerful but require operational overhead.
Large-Scale, Complex Systems: Commercial platforms often justify their cost by simplifying management, offering advanced features, and providing integrated support across diverse environments.
Cloud-Native: Consider native cloud provider services or platforms optimized for Kubernetes and serverless.
Start with OpenTelemetry: Regardless of your backend choice, investing in OpenTelemetry instrumentation provides flexibility for future changes.
Designing for observability is an ongoing journey, not a one-time project. It requires continuous effort to instrument applications, collect data, analyze insights, and iterate on your systems. The outcome, however, is a more resilient, performant, and understandable software ecosystem, driving better business outcomes and a more positive experience for both users and engineers.
What real-world challenges have you faced implementing observability in your software engineering projects, and what patterns or tools proved most effective in overcoming them?
💬 Join the conversation — share your take in the comments and tell us what you’d add.